AP Statistics Ch 3 and 4 Lessons on Correlation and Least Square Regression Lines
Click to open AP Statistics Lessons on Correlation, LSRL, Residual Plots, Evaluating Regression Models
- 3.1 Scatterplots and Correlations
- 3.2 Regression Line
- 3.3 Residual Plots and Assessing Correlation
- 4.1 Using Logarithmic Transformations to Achieve Linearity
- 4.2 Relationship between two categorical variables
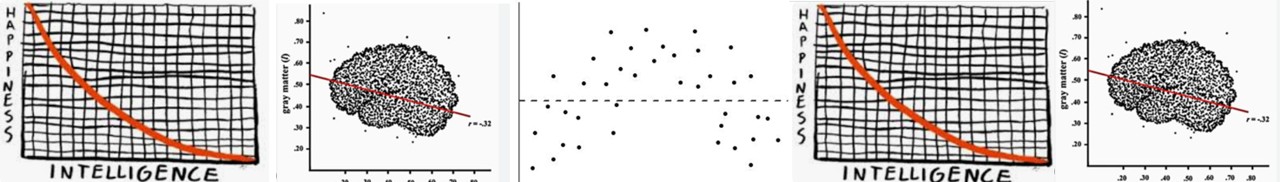
- 4.3 Cautions about Correlation and Regression
- 4.R Chapter 4 Review Regression and Residuals
- 4.R Chapter 4 Review
AP Statistics Regression and Correlation Worksheets
AP Statistis Worksheets on Correlation, Regression, and Residual Plots.
AP Statistics Ch 3 Assignments on Correlation and Residual Plots
- AP Stat Assign 3.1
- AP Stat Assign 3.1 Correlation LSRL
- AP Stat Assign 3.2
- AP Stat Assign 3.2 Residual, Slopes of Regression Lines
- AP Stat Assign 3.3
- AP Stat Assign 3.3 Lurking Variables, Residual Plots, and Outliers
- AP Stat Assign 3.4 (with answers)
- AP Stat Assign 3.4 Extra Practice Questions on Regression Models
- AP Stat Assign 3.R 3 and 4 Ch Review 2023
- AP Stat Assign 3.x
AP Statistics Ch 4 Assignments on Regression Models
- AP Stat Assign 4.1 (2019)
- AP Stat Assign 4.1 Regression Models
- AP Stat Assign 4.2 (2019)
- AP Stat Assign 4.2 Two Way Tables
- AP Stat Assign 4.3 (2019)
- AP Stat Assign 4.3 Confounding and Lurking Variables.pdf
Chapter Reviews
Extra Assignments
Answer Keys
Answer key are made by students from Moscrop Secondary School.
PowerPoints for AP Statistics on Correlation and Regression Models
- 3.1 Scatterplots and Correlations
- 3.2 Regression Line
- 3.3 Residual Plots and Assessing Correlation
- 4.1 Using Logarithmic Transformations to Achieve Linearity
- 4.2 Relationship between two categorical variables
- 4.3 Cautions about Correlation and Regression
- 4.R Chapter 4 Review Regression and Residuals
- 4.R Chapter 4 Review
PPractice Exam for Bivariate Data
Quick self-checks and formative quizzes.