|
||
      |
 |
AP Stats Chapter 1: • Preface-What is Statistics and defining New Terms? • Unit 1.1 Understanding Data with BoxPlots • Unit 1.2 Normal Distribution and Relative Standing • Ch1 Practice Test • Pre-Chapter Review • Chapter 1 Review |
PPT • 1.1 • 1.2 |
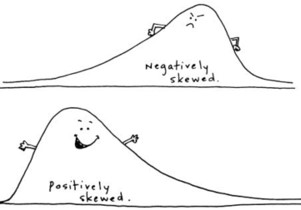
Box Plots, Normal Distributions, and Basic Terminology In this Unit, students will learn to: • Understand the meaning of Quantitative vs Categorical Variables • Represent Data of a Univariate Variable using Boxplots Make and Identifying Outliers • Analyzing Distributions of Boxplots with Measures of Central Tendencies: Min, Max, Q1, Q3, Median, IQR, and Range • Understand how Mean and Standard Deviations are used to describe distributions that are normally distributed |
|||
 |
AP Statistics Chapter 2: |
PPT • 2.1 • 2.2 |
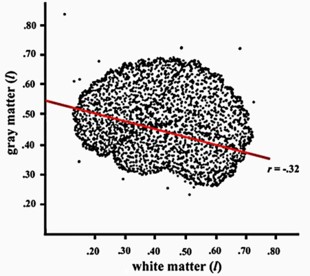
Normal Distributions and Z-scores In this Unit, students will learn to: • Compute the measures of relative standning of individuals in a normal distribution • Use Z-scores and percentiles to calculate probabilities with Normal Distributions • Apply the Empirical rule of 68-95-99.7 for problems that involves normal distributions • Use the normalcdf function on your calculator to calculate probabilities |
|||
 |
AP Statistics Chapter 3: • Unit 3.1 Correlations Between Two Quantitative Variables • HW 3.1 and SOL • Unit 3.2 Least -Squares Regression Line and Residuals • HW 3.2 and SOL • Unit 3.3 Assessing LSRL using Residual Plots and Std Dev of Residuals • HW 3.3 and SOL • Chapter 3 Review |
PPT • 3.1 • 3.2 • 3.3 • C3R |
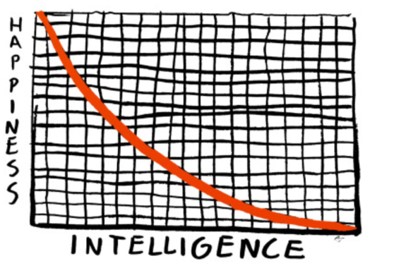
Least Square Regression Line |
|||
 |
AP Statistics Chapter 4: • Unit 4.1 Different Types of Regressions • HW 4.1 and SOL • Unit 4.2 Two Way Tables and Relationships Between Categorical Variables • HW 4.2 and SOL • Unit 4.3 Defining Causation and Identifying Lurking & Confounding Vaiables • HW 4.3 and SOL • Chapter 4 Review |
PPT • 4.1 • 4.2 • 4.3 • C4R |
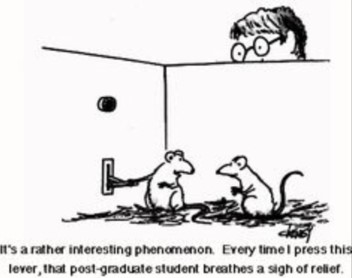
Different Types of REgression Models and Confounding/Lurking Variables |
|||
 |
AP Statistics Chapter 5: |
PPT • 5.1 • 5.2 • 5.3 • C5R |
Data Collection and Experimental Design |
|||
 |
AP Statistics Chapter 6: • Unit 6.1 Simulations and Probability Experiments • Unit 6.2 Independent Events and Conditional Probability • Unit 6.3 General Probability Rules • Chapter 6 Condensed • Chapter 6 Review |
PPT • 6.1 • 6.2 • 6.3 • C6R |
Probability Rules In this chapter, students will learn: • Design and perform probability simulations • Define probability concepts: Independent vs Dependent events, Joint events, union, complement events • Solve probability problems with Bayes's rule |
|||
 |
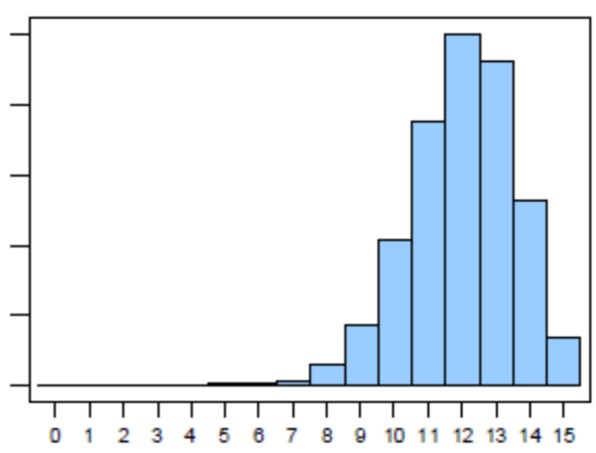
AP Statistics Chapter 7: • Unit 7.1 Continuous Random Variables: Formulas for Converting and Combinging Random Variables • Unit 7.2 Discrete Random Variables Finding Means and Variance • Ch 7 Condensed Lesson on Random Variables • Chapter 7 Review |
PPT • 7.1 • 7.2 • 7.3 • C7R |
Random Variables
|
|||
 |
AP Statistics Chapter 8: • Unit 8.1 Binomial Distributions • Unit 8.2 Geometric Distributions • Chapter 8 Review |
PPT • 8.1 • 8.2 • C8R |
Binomial and Geometric Distributions In this chapter, students will learn to: • Explain what a Binomial Distribution is • Calculate the mean and variance of a binomial random variable • Solve problems involving geometric settings |
|||
 |
AP Statistics Chapter 9: |
PPT • 9.1 • 9.2 • 9.3 |
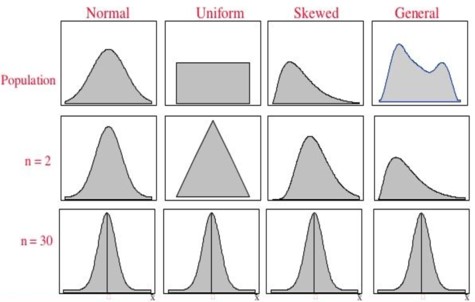
Sampling Distributions |
|||
 |
AP Statistics Chapter 10: |
PPT • 10.1 • 10.2 • 10.3 |
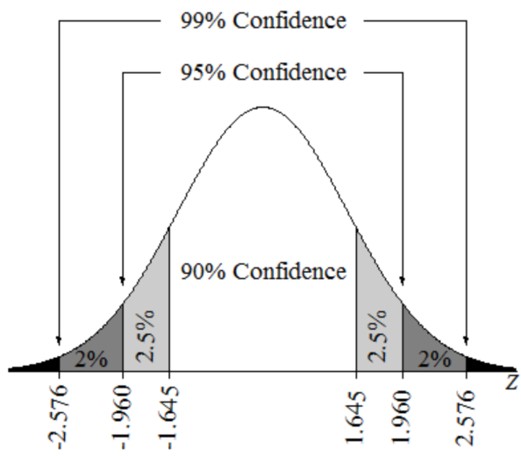
Confidence Intervals In this chapter, students will learn: • Describe statistcal inference & margin of error • Describe and construct a confidence interval for a population mean and for a population proportion • Distinguish the difference between t-distribution and Normal distribution |
|||
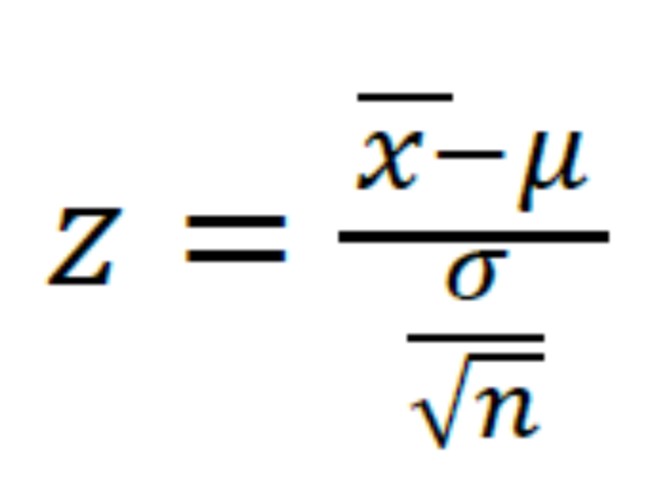 |
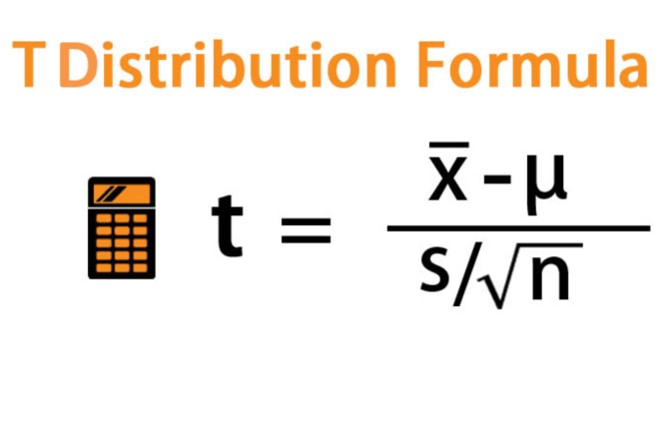
AP Statistics Chapter 11: • Unit 11.1 Performing a Significance Test for a Z-Distribution and T-Distribution • Unit 11.2 Performing a Significance Test for the Proportion of a Z-Distribution • Unit 11.3 and 11.4 Type 1 and Type 2 Errors, Power and Beta • Chapter 11 Condensed Lesson • Chapter 11 Review |
Significance Test and Testing a Claim |
||||
 |
AP Statistics Chapter 12: • Hypothesis Tests for Two Tail Scenarios |
PPT • 12.1 • 12.2 |
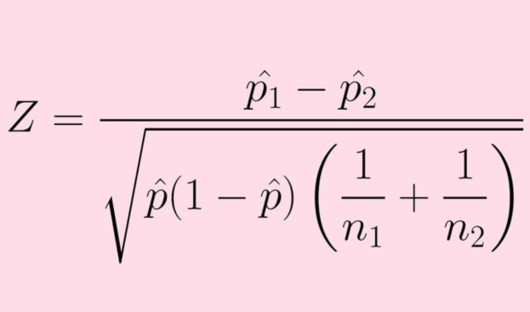
Confidence Interval for the Difference of Two Population Means or Proportion |
|||
 |
AP Statistics Chapter 13: • Unit 13.1 Performing a Significance Test on Two Population Means Using T or Z-Distributions • Unit 13.2 Performing a Significance test of Two Popluation Proportions • Chapter 13 Review |
PPT • 13.1 • 13.2 • 13R |
Performing a Significance Test of the Difference of Two Population Means or Proportions In this chapter, students will learn: • Conduct a signficance test comparing two population means and two population proportions • You will also learn to conduct these tests using a T-distribution, where the sample population is not given. |
|||
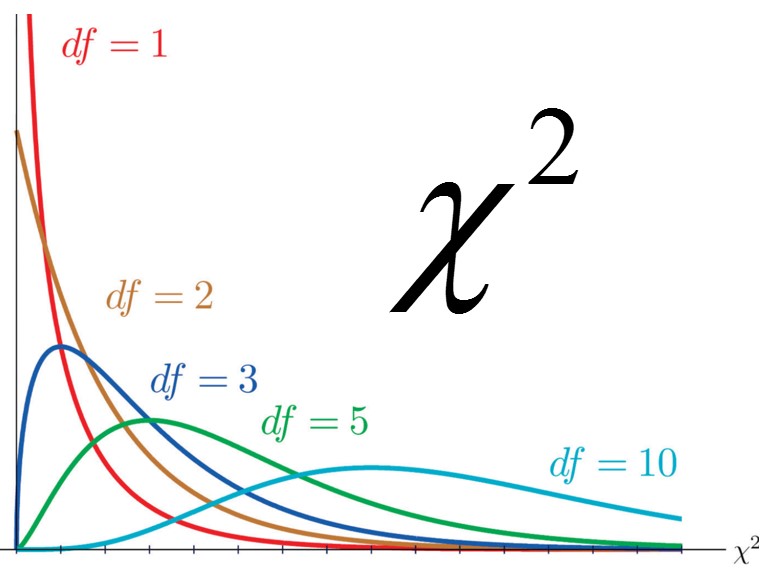 |
AP Statistics Chapter 14: • Unit 14.1 Test Goodness of Fit • Unit 14.2 Test for Homogeniety or Association • Chapter 14 Review |
PPT • 14.1 • 14.2 • 14R |
Chi-Squares In this chapter, students will learn: • to develop a project plan that involves collecting, displaying , and analysing data • to select a sample from a population • to understand the various aspects of collecting data |
|||
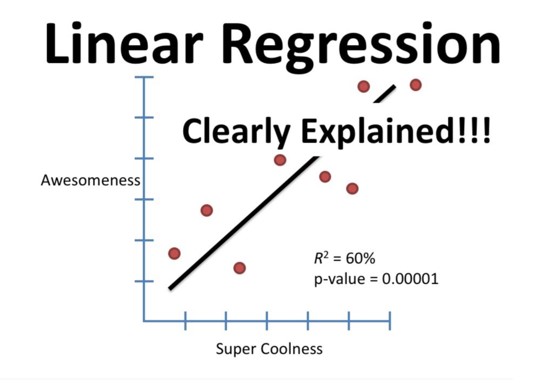 |
AP Statistics Chapter 15: • Unit 15.1 Test for the Slope and Y-intercept of a Regression Line • Chapter 15 Review |
PPT • 15.1 • 15R |
Regressions In this chapter, students will learn: • to develop a project plan that involves collecting, displaying , and analysing data • to select a sample from a population • to understand the various aspects of collecting data |
|||

