
SECTION 10.1LINEAR RELATIONS
© Copyright all rights reserved to Homework depot: www.BCMath.ca
I) X AND Y AXIS ON A CARTESIAN PLANE
X-axis (Horizontal) is known as the independent axis
Y-axis (Vertical) is known as the dependent axis
Each point on the grid has a coordinate in the form of (x,y)
x
y
0
1
2
3
4
5
6
7
1
2
3
4
5
6
7
X-axis (Horizontal)
Y-axis(Vertical)
Origin(0,0)
© Copyright all rights reserved to Homework depot: www.BCMath.ca
The numberon the left isthe “x” value(left/right)
The numberon the right isthe “y” value(UP/DOWN)
HOW TO READ GRAPHS
When reading a graph, the numbers on the axis tells ushow fast the values are changing
Ie: John works at Starbucks and the graph tells us howmuch he makes:
x
y
0
1
2
3
4
5
6
7
10
20
30
40
50
60
70
John’s Salary
Income ($)
Work Hours
What does each axis represent?
How much does he earn each hour?
What is the relationship betweenhis income and work hours?
The “X” axis tell us how many hourshe worked. The “Y” axis tell ushow much he is earning
For each additional hour, he gets$10 more. So he earns $10 per hour
II) LINEAR RELATIONS
“Linear” means ‘straight line’
Two variables have a relationship if one variable canaffect the other
ie: your salary vs how many hours your work
How much you pay vs how much you buy
A relationship is linear if the two variables increase ordecrease at a constant ratio
Ie: each hour you work, your salary increases by $20
You pay another $25 for each additional hour of tutoring...
When you graph a linear relationship, you will get astraight line
© Copyright all rights reserved to Homework depot: www.BCMath.ca
EX: GIVEN EACH SCENARIO, INDICATE WHETHER IF ITWOULD BE LINEAR OR NOT
i) Jack makes 5 dollars every day.
ii) Tom deposits $1 in the bank on the first day, $2 the next day,and then $4, $8, doubling each day.
iii) A taxi driver charges you $5.00 for the first minute and then$1.25 for every minute afterwards.
iv) 3 muffins cost $2.00. 6 muffins costs $3.50
Yes, because the increase for each day is consistent
No, because the amount deposited is not consistent,it’s doubling each day
Yes. Although there is an initial charge, the amount for each additionalminute is the same
NO, because if you buy more, the cost per muffin is less.
Ie: for 3 muffins, the cost is $0.67 each. For 6 muffins, it’s $0.58 each
HOW TO GRAPH A LINEAR FUNCTION:
Make a Table of Values to show the relationshipbetween the two variables
Ie: The cost for “N” number of minutes
Determine which variable will be the independentvariable (X-axis)
ie: Time, number of donuts, number of people, hours worked
Determine which variable will be the dependentvariable (Y-axis)
Ie: Cost, salary, weight, ..etc
Map out the data pairs onto your graph
For each “x” value you will get a “y” value
Make a Title for the Graph
Label both the “X” and “Y” axis
Ex: A tutoring centre charges $10 for the registration feeand then $20 per hour of tutoring.
i) Make a table of values
ii) Graph the data
iii) Find the cost for 6hours of tutoring
y
0
1
2
3
4
5
6
7
8
9
20
40
60
80
100
120
140
160
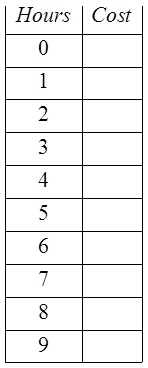
The cost for 0 hoursof tutoring is $10
© Copyright all rights reserved to Homework depot: www.BCMath.ca
For each hour, thecost increases by $20
This relationship islinear because thepoints on the graph canmake a straight line
The cost for 6hours of tutoring
is $130
Cost vs Hours of Tutoring
Cost ($)
Hours (h)
y
0
1
2
3
4
5
6
7
8
9
20
40
60
80
100
120
140
160
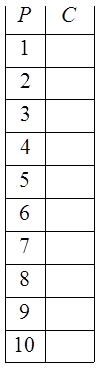
Practice: The cost for renting a banquet hall is $25 for one person,$40 for two people, $55 for three people, and then $15 for eachadditional person. Make a TOV.i) Draw a graph to illustrate the cost vs number of people
ii) Find the initial cost:
The initial cost is $10because the line crossesthe Y-axis at $10
© Copyright all rights reserved to Homework depot: www.BCMath.ca
Cost for Banquet Hall
Cost ($)
# of people
NOTE: You can not havehalf a person coming or 1.5person. So don’t connectthe dots!!